A3.2 Introduction to Structural Systems
How do structures carry loads, resist forces and remain stable?
Starter · Look around the classroom
Find one structure that is mainly a frame, one that behaves like a shell, and one solid component. Be ready to justify each choice.
3.2.1 Structures in Nature and the Built Environment
A structure is a system of parts designed to support loads, resist forces and maintain its shape. Structures are not limited to buildings: a leaf, a bicycle and the human skeleton all depend on an organised arrangement of material.
A structure is defined by what it does, not only by what it looks like.
Nature as a designer
Natural structures often achieve high performance with little material. Their form has developed in response to a function:
| Natural structure | What to notice | Structural benefit |
|---|---|---|
| Spider web | radial and spiral threads | carries tension with very little material |
| Honeycomb | repeated hexagonal cells | encloses space efficiently and shares loads |
| Leaf veins | branching network | supports the leaf and transports nutrients |
| Eggshell | thin, curved surface | protects the contents and spreads load |

Spot it
Trace the load path with your finger: where does an applied force travel, and which parts finally support it?
Human-made structures
Designed structures respond to a purpose and a context. A bridge spans a gap; a building provides shelter; a dam holds back water; a chair supports a user. Designers balance:

form · function · materials · forces · culture · cost
Think like a designer
Do not write only, “It is strong.” Explain why: “The curved shell spreads the load over its surface, so a thin layer of material can resist the force.”
A six-question analysis routine
- What is its purpose?
- What loads act on it?
- Where are the supports?
- How does the shape carry the load?
- Why is this material suitable?
- Where might it deform or fail?
Common mistake
Naming a structure is description. Explaining how its parts, shape and material resist forces is analysis.
3.2.2 Classification of Structures
The three main structural types are frame, shell and solid. Many real products combine more than one type.
Frame
A skeleton of interconnected members.
Strength comes from: arrangement and joints.
Clue: you can see spaces between the members.
Shell
A thin surface that encloses a space.
Strength comes from: surface and shape.
Clue: the skin carries and spreads the load.
Solid
A mass of material that resists through its bulk.
Strength comes from: material and cross-section.
Clue: little or no internal empty space.
Frame structure · bicycle

The tubes form interconnected triangles. This provides rigidity and load distribution while keeping mass low. Frames are useful when the goal is high strength with low weight.
Look for the same principle in scaffolding, cranes, roof trusses, furniture and skeletons.
Shell structure · drinks can

A can uses a very thin sheet of aluminium. Its cylindrical form creates rigidity, encloses liquid and distributes loads. Shells are useful for protection, enclosure, aerodynamics and watertightness.
Other examples include helmets, eggshells, domes, vehicle bodies and aircraft skins.
Solid structure · dam and engine block

Solid structures are usually stable, durable and difficult to deform, but they often have greater mass, material use and cost. Examples include dams, foundations, hammer heads, teeth and machine parts.
Quick check
A crash helmet has a hard outer skin and a thick foam liner. Is it frame, shell or solid? Answer: it is a combination—the outer shell spreads impact while the foam behaves as a solid energy-absorbing layer.
Why combine types?
| Product | Frame | Shell | Solid |
|---|---|---|---|
| Car | chassis | body panels | engine block |
| Building | columns and beams | cladding | foundations |
| Aircraft | fuselage ribs | external skin | landing gear components |
| 3D printer | rigid gantry | enclosure | motor housings |
Classification depends on how each part carries load; one product may contain all three types.
3.2.3 Structural Components
Structural members create a path that transfers loads safely to the supports and, eventually, to the ground.
Beams and columns
- A beam usually carries loads across a horizontal distance.
- A column usually carries compressive loads vertically towards the foundations.

| Beam type | How it is supported | Easy-to-recognise example |
|---|---|---|
| Simply supported | support at both ends; ends may rotate | shelf resting on two brackets |
| Fixed | rigidly fixed at both ends | beam cast into concrete walls |
| Cantilever | fixed at one end; other end is free | balcony or diving board |
| Continuous | extends over more than two supports | long multi-span bridge deck |
Photo challenge · Identify the beam type
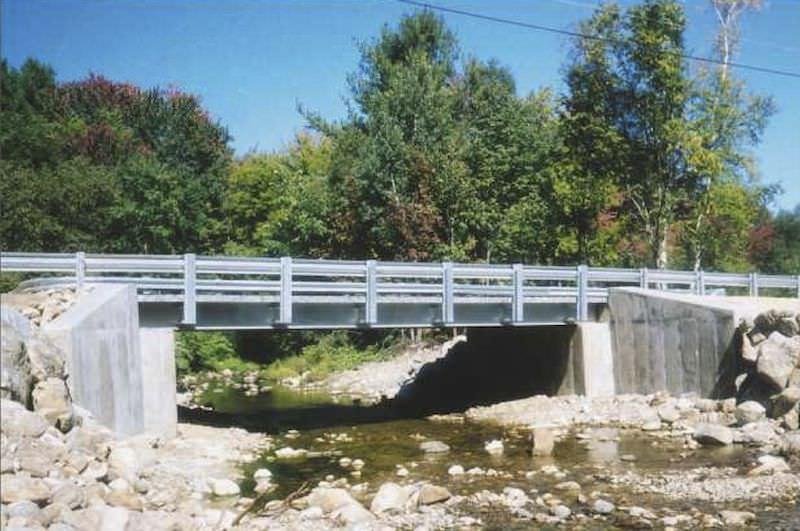
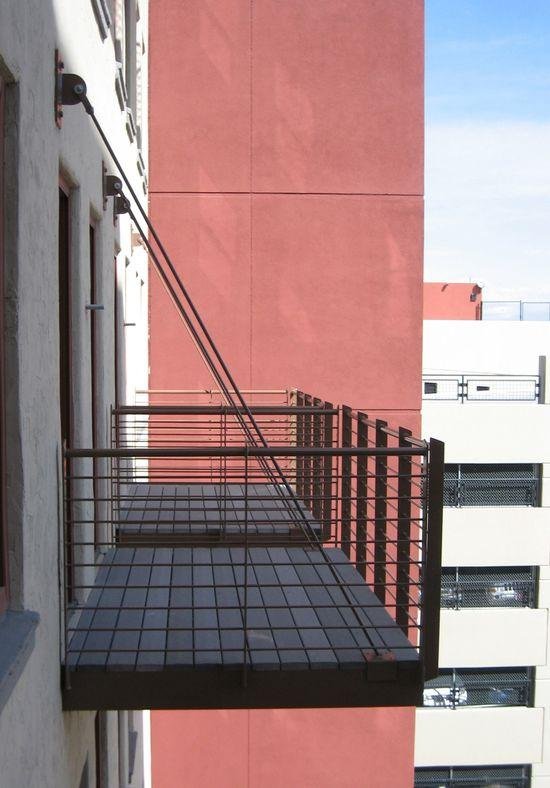

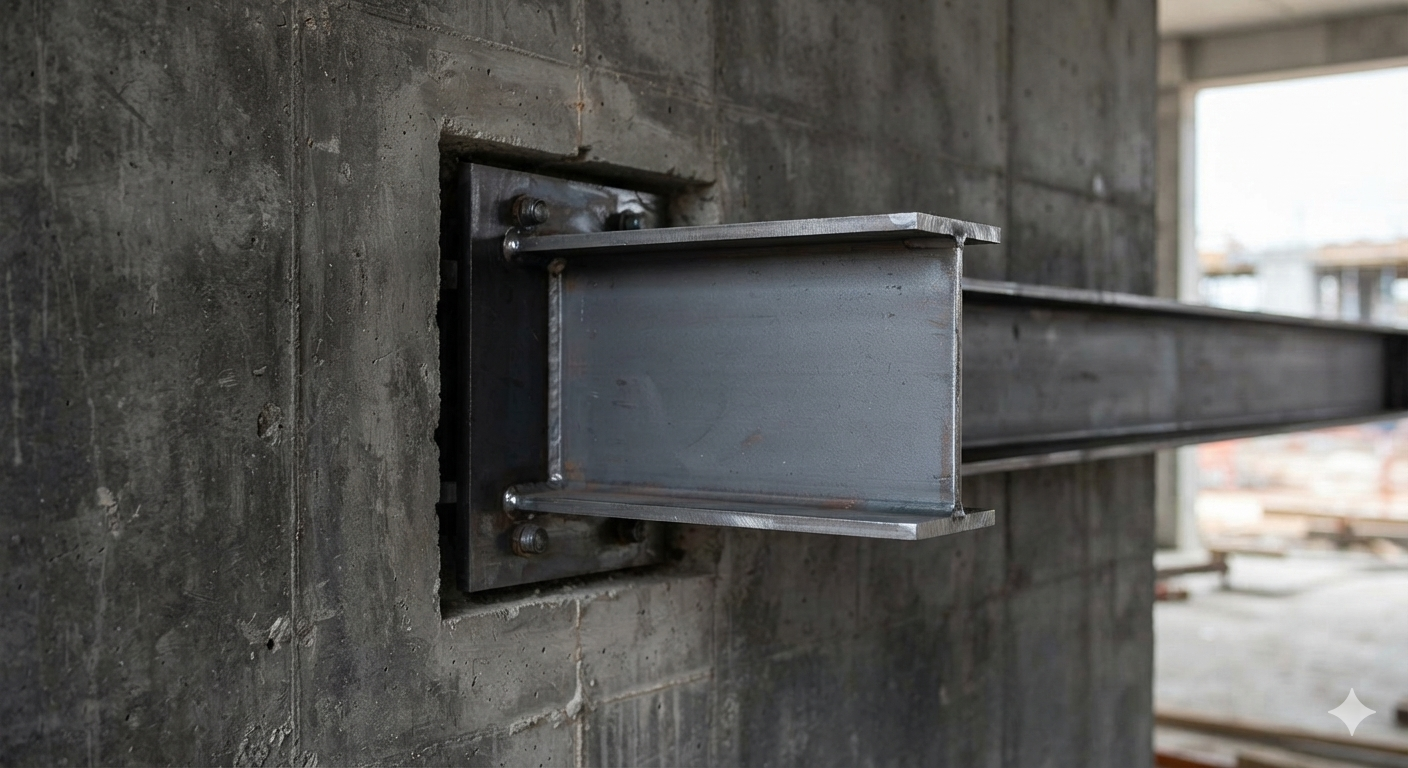
Identify the beam types
Which beam type is shown in each photograph A–D? Choose the best description from simply supported, fixed, cantilever or continuously supported.
For each answer, justify your decision by describing:
- the number and position of the supports;
- whether either end appears free to move or rotate;
- any additional support that makes the real structure more complex than the simplified model.
Suggested analysis
- A — Simply supported: the bridge deck spans between supports at each end.
- B — Stayed cantilever: the balcony projects from the building, but diagonal tension stays provide additional support. It is not a pure cantilever.
- C — Continuously supported: one deck extends across several piers, so the load is shared between multiple supports.
- D — Insufficient evidence from this view: the visible end is rigidly fixed. If the unseen end is free, it is a cantilever; it is a fixed beam only if the other end is also fixed.
Recognition technique
Cover the object itself and inspect only its supports. Beam names describe the support condition, not the material or appearance.
Columns
Columns are vertical structural members designed primarily to transfer compressive loads.
They carry loads from above, such as:
- roofs,
- upper floors,
- beams.
These forces are transferred downward towards the foundations.
Columns therefore contribute to the stability of the complete structure.
Examples
- columns in classical Greek temples,
- timber or steel columns in buildings,
- table legs,
- chair legs.
In residential buildings, columns can replace some load-bearing walls, allowing designers to create more open interior spaces.
Key Idea
Beams mainly carry loads across horizontal distances, while columns transfer loads vertically towards the foundations.
Load-path example
Person on a balcony → balcony beam → fixed connection → building frame → foundations → ground
The free end of a cantilever needs no column below it, but the fixed connection must resist a large bending effect.
Check your understanding
Why is a diving board a cantilever but a shelf on two brackets is usually simply supported?
Answer
The diving board is fixed at one end and free at the other. The shelf transfers load to supports near both ends.
3.2.4 Static, Dynamic and Structural Forces
A load is an external action on a structure. Loads create internal forces and stresses in its members.
Static and dynamic loads
| Static | Dynamic |
|---|---|
| constant or slowly changing | changes with time or movement |
| little impact or vibration | may include impact or vibration |
| roof weight, books on a shelf | traffic, wind gusts, a person jumping |
Important distinction
“Static” does not mean “small,” and “dynamic” does not mean “large.” The distinction is whether the load changes significantly with time.
The five actions
| Action | What the material does | Everyday memory cue |
|---|---|---|
| Compression | shortens or squashes | chair leg |
| Tension | lengthens or pulls apart | rope in tug-of-war |
| Bending | curves; one side compresses and the other stretches | diving board |
| Torsion | twists around an axis | screwdriver shaft |
| Shear | adjacent parts slide in opposite directions | scissors cutting paper |
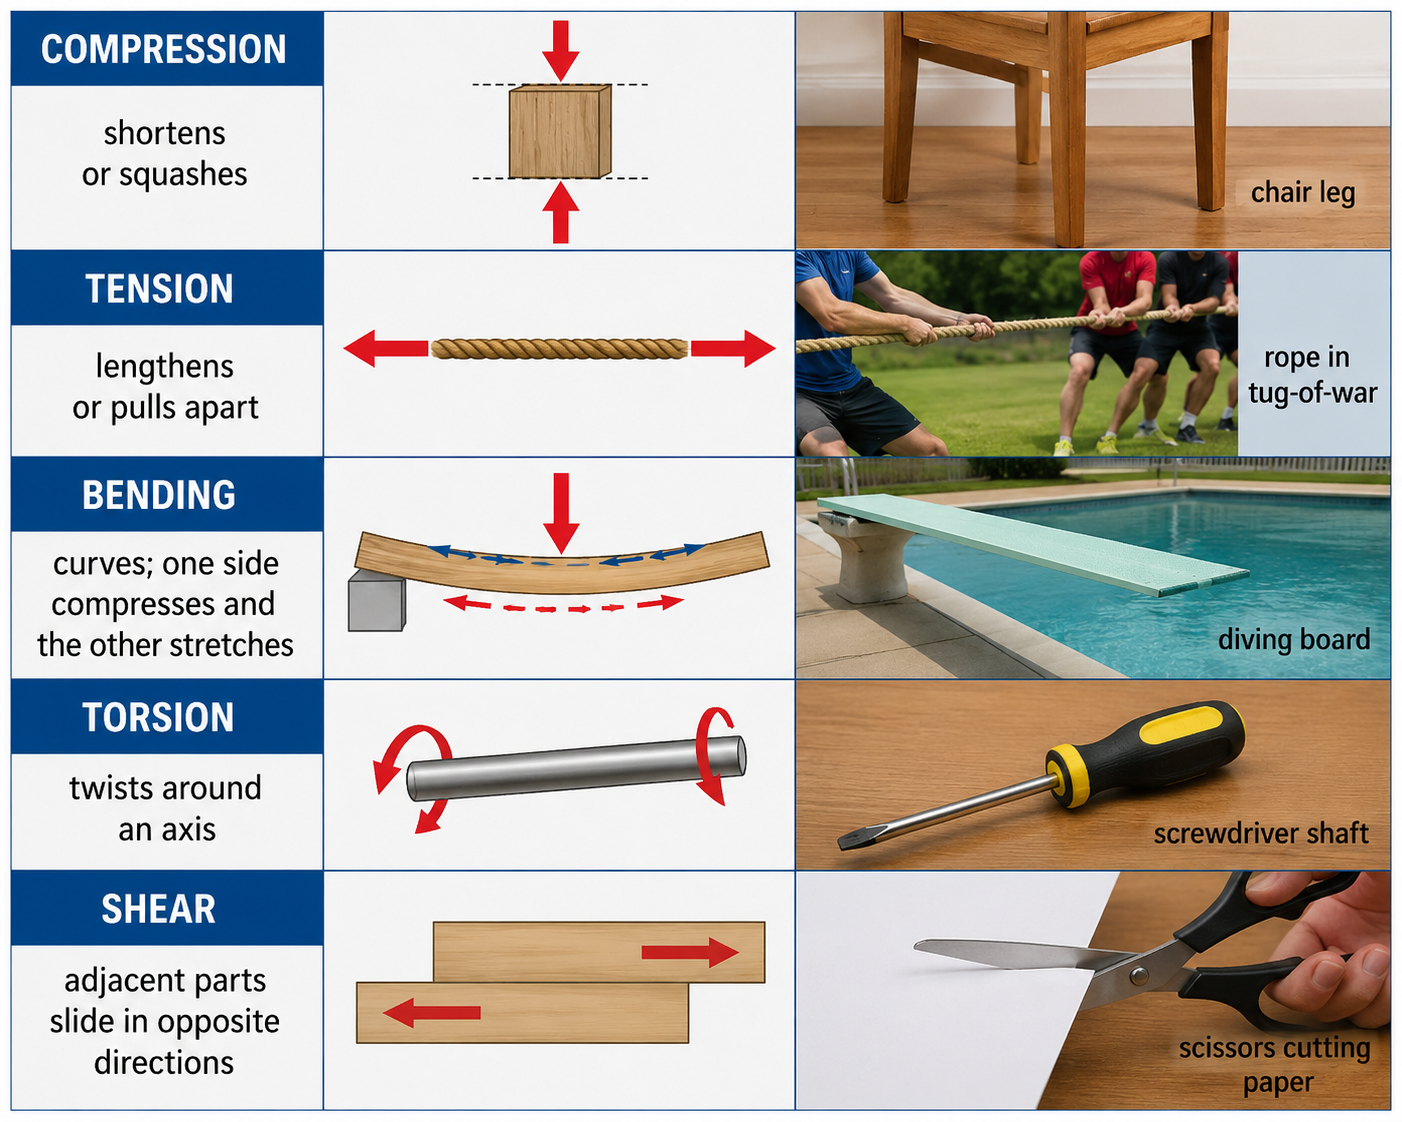
Push = compression · Pull = tension · Curve = bending · Twist = torsion · Slide = shear
Use your hands
Mime each action while saying its name. Linking a technical term to a physical movement makes it easier to retrieve later.
Forces act together
When a beam bends, the inside of the curve is in compression and the outside is in tension. Bolts at its connection may also experience shear. Analyse the complete load path rather than assigning only one force to an entire product.
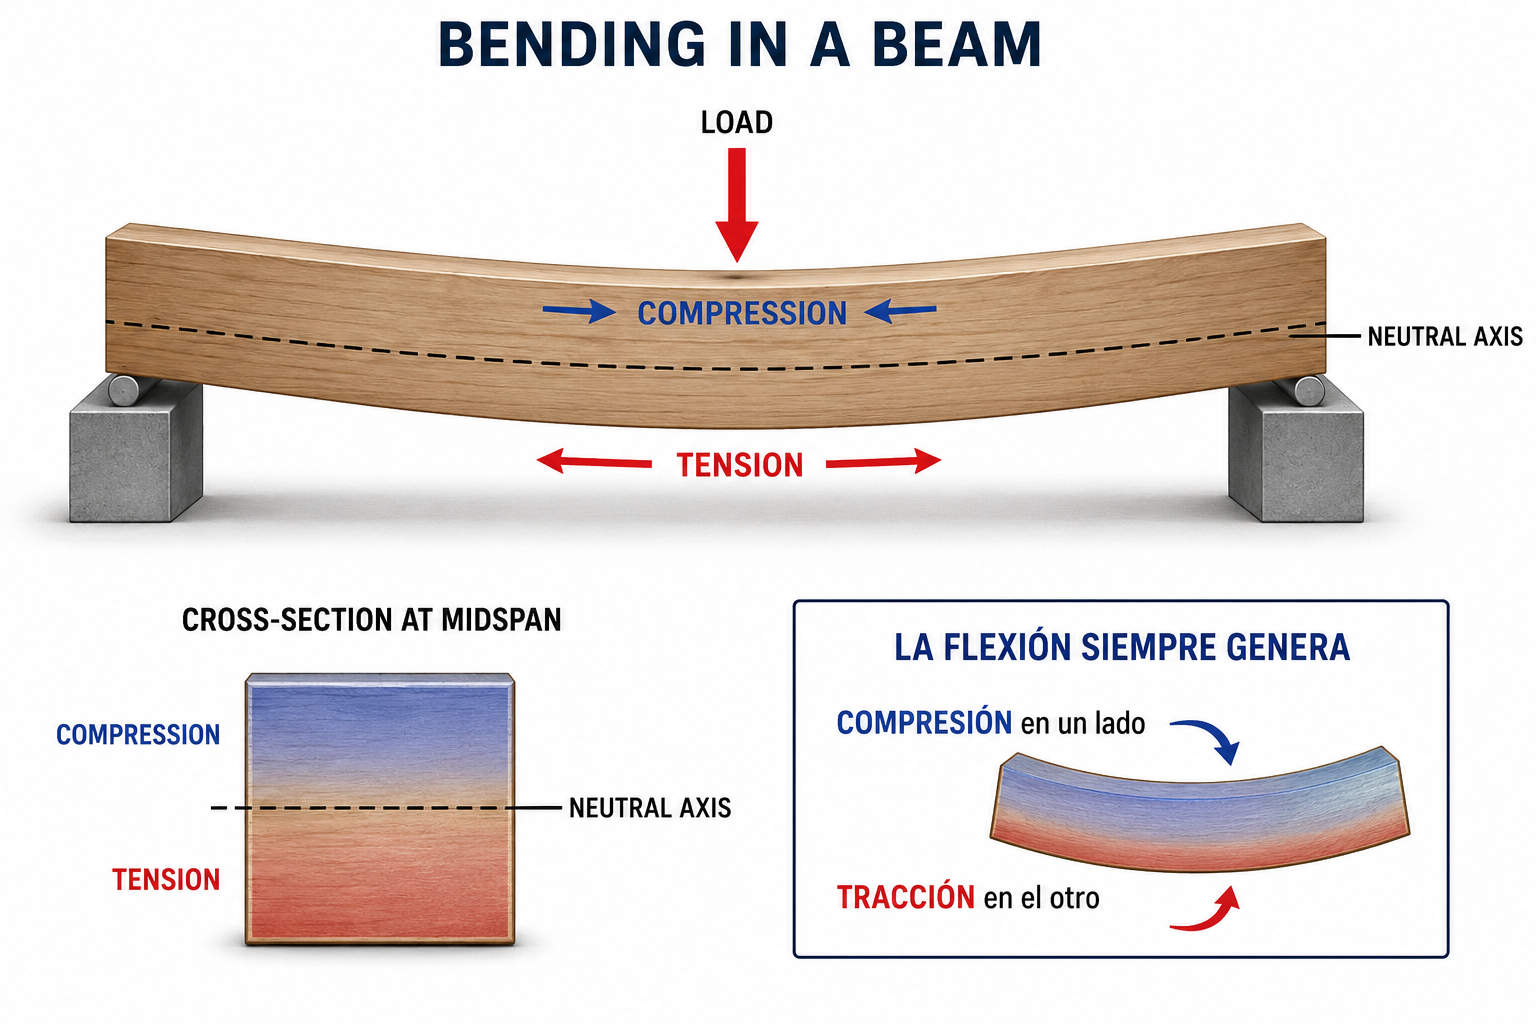
Bending always creates tension on one side and compression on the other.
3.2.5 Stress, Strain and Material Failure
Stress
Stress is the force applied to a material divided by the cross-sectional area supporting that force.
It indicates how much force a material experiences per unit of area.
The formula for stress is:
σ=FAWhere:
- σ (Stress): Stress experienced by the material.
- F (Force): Applied force, measured in newtons (N).
- A (Area): Cross-sectional area, measured in mm².
Stress is measured in pascals (Pa). However, in engineering and product design, megapascals (MPa) are commonly used.
1MPa=1,000,000Pa=1N/mm21. Practical Example: The Legs of a Chair
Imagine you are designing a chair and need to ensure that its legs can safely support the weight of a person.
You are considering two designs made from the same material. Assume that each leg carries an axial force of 500 N:
| Characteristic | Leg A (Thick) | Leg B (Thin) |
|---|---|---|
| Applied force | 500 N | 500 N |
| Cross-sectional area | 500 mm² | 100 mm² |
| Stress | 1 MPa | 5 MPa |
Stress Calculation
Leg A (Thick):
σ=500500=1N/mm2=1MPaLeg B (Thin):
σ=500100=5N/mm2=5MPaWhat can we observe?
The thinner leg experiences five times more stress than the thicker leg, even though both support exactly the same force.
This means that the thinner leg is closer to reaching the material's strength limit, assuming the same material and loading conditions.
2. Fundamental Principles
- Greater force → Greater stress: Increasing the weight supported by the chair increases the stress in its legs, assuming the load distribution remains unchanged.
- Smaller area → Greater stress: Reducing the cross-sectional area of the legs increases the stress they experience.
- Larger area → Lower stress: Thicker legs distribute the force over a larger cross-sectional area, reducing stress.
- Direction of force: Forces can act horizontally or vertically. What matters is how the force acts relative to the material's cross-section.
3. Why Is Stress Important in Design Technology?
Understanding stress allows designers to:
- Select suitable materials for a specific application.
- Determine the required thickness of structural components.
- Prevent permanent deformation and material failure.
- Design safe products while using an appropriate amount of material.
Key Takeaway
Stress depends not only on the applied force but also on the cross-sectional area supporting that force.
In the chair example, increasing the thickness of the legs reduces stress under the same axial load. However, it also increases the amount of material required.
The designer's objective is to achieve the right balance between strength, safety, weight, and cost.
Strain
Strain describes how much a material changes in length compared with its original length when a force is applied.
While stress measures force per unit of cross-sectional area, strain measures the relative change in length of a material.
For example, when someone sits on a chair, its legs may become slightly shorter under compression. Strain tells us how large that change is relative to the legs' original length.
Strain formula
ε=ΔLL0Where:
- ε (strain): Relative change in length.
- ΔL (change in length): Final length minus original length.
- L₀ (original length): Length before the force is applied.
Strain has no unit because it is the ratio of two lengths measured in the same unit.
1. Practical example: The legs of a chair
Imagine you are designing a chair and want to determine how much its legs deform when a person sits down.
Consider two legs made from different materials:
- Leg A: Steel.
- Leg B: Plastic.
Both are initially 500 mm long and experience the same compressive force. Under load, they shorten by different amounts.
| Characteristic | Leg A (Steel) | Leg B (Plastic) |
|---|---|---|
| Original length | 500 mm | 500 mm |
| Length under load | 499.9 mm | 499 mm |
| Reduction in length | 0.1 mm | 1 mm |
| Magnitude of strain | 0.0002 | 0.002 |
These values are illustrative and are used to explain the concept.
Worked example: Calculating strain
Leg A (Steel)
ΔL=499.9−500=−0.1mm ε=−0.1500=−0.0002Leg B (Plastic)
ΔL=499−500=−1mm ε=−1500=−0.002What can we observe?
The plastic leg experiences 10 times the magnitude of strain of the steel leg. Even though both experience the same force, the plastic leg shortens proportionally more in this example.
The sign tells us the direction of the length change:
- Positive strain (+): The material becomes longer (tensile strain).
- Negative strain (−): The material becomes shorter (compressive strain).
2. Fundamental principles of strain
A. Greater relative deformation → Greater magnitude of strain
For two components with the same original length, the one that changes length more experiences a greater magnitude of strain.
B. Strain depends on the original length
Two bars can extend by the same number of millimetres but experience different strains.
Bar A: Original length = 100 mm; extension = 1 mm.
ε=1100=0.01Bar B: Original length = 1{,}000 mm; extension = 1 mm.
ε=11,000=0.001Although both bars extend by 1 mm, Bar A experiences 10 times more strain, because the extension represents a larger proportion of its original length.
C. Strain has no units
Strain can also be expressed as a percentage:
0.002×100=0.2%A strain magnitude of 0.002 means that the length has changed by 0.2% of its original value.
3. Why is strain important in Design Technology?
Understanding strain helps designers to:
- Measure deformation: Calculate the proportional change in a component's length under load.
- Compare materials: Evaluate how different materials deform under equivalent loading conditions.
- Maintain functionality: Prevent excessive deformation that could stop a product from working correctly.
- Optimise designs: Select dimensions and materials that keep deformation within acceptable limits.
Returning to the chair example:
When a person sits down, the legs support a load. Designers need to answer two different questions:
- Stress: How much force per unit area do the legs experience?
- Strain: How much do the legs shorten relative to their original length?
It is not enough for the legs to avoid breaking. Their deformation must also remain small enough to maintain the chair's stability and function.
4. Connecting stress, strain and stiffness
Now that stress and strain have been defined, we can examine how they are related.
Applying a force to a component creates stress, and the material may respond by deforming, producing strain. However, two materials subjected to the same stress do not necessarily experience the same strain.
This difference is related to stiffness, or resistance to deformation.
Young's modulus
Young's modulus (E) measures a material's resistance to elastic deformation under tensile or compressive stress.
Within the linear elastic region:
E=StressStrain=σε- High Young's modulus → Stiffer material: A given stress produces relatively little strain (e.g. steel).
- Low Young's modulus → More easily deformed material: The same stress produces more strain (e.g. rubber).
Important: Young's modulus is a material property. The stiffness of an actual component also depends on its dimensions and geometry. Stiffness and strength are not the same thing.
5. Summary: Stress, strain and Young's modulus
| Concept | Stress | Strain | Young's modulus |
|---|---|---|---|
| What does it describe? | Force per unit area | Relative change in length | Resistance to elastic deformation |
| Formula | σ=F/A | ε=ΔL/L0 | E=σ/ε |
| Unit | Pa or MPa | No unit | Pa or GPa |
| Key question | How intensely is it loaded? | How much does its length change proportionally? | How resistant is the material to elastic deformation? |
Key takeaway
Stress measures the force per unit area acting on a material, while strain measures the resulting change in length relative to its original length.
Young's modulus relates stress and strain within the linear elastic region and allows us to compare the elastic stiffness of materials.
In chair design, the legs must not only support a person's weight without failing; they must also deform little enough to keep the chair stable and safe.
Reading a stress–strain graph
A stress–strain graph shows how a material responds as it is gradually pulled in a tensile test, until it fractures. It helps designers understand deformation, stiffness, strength and ductility.
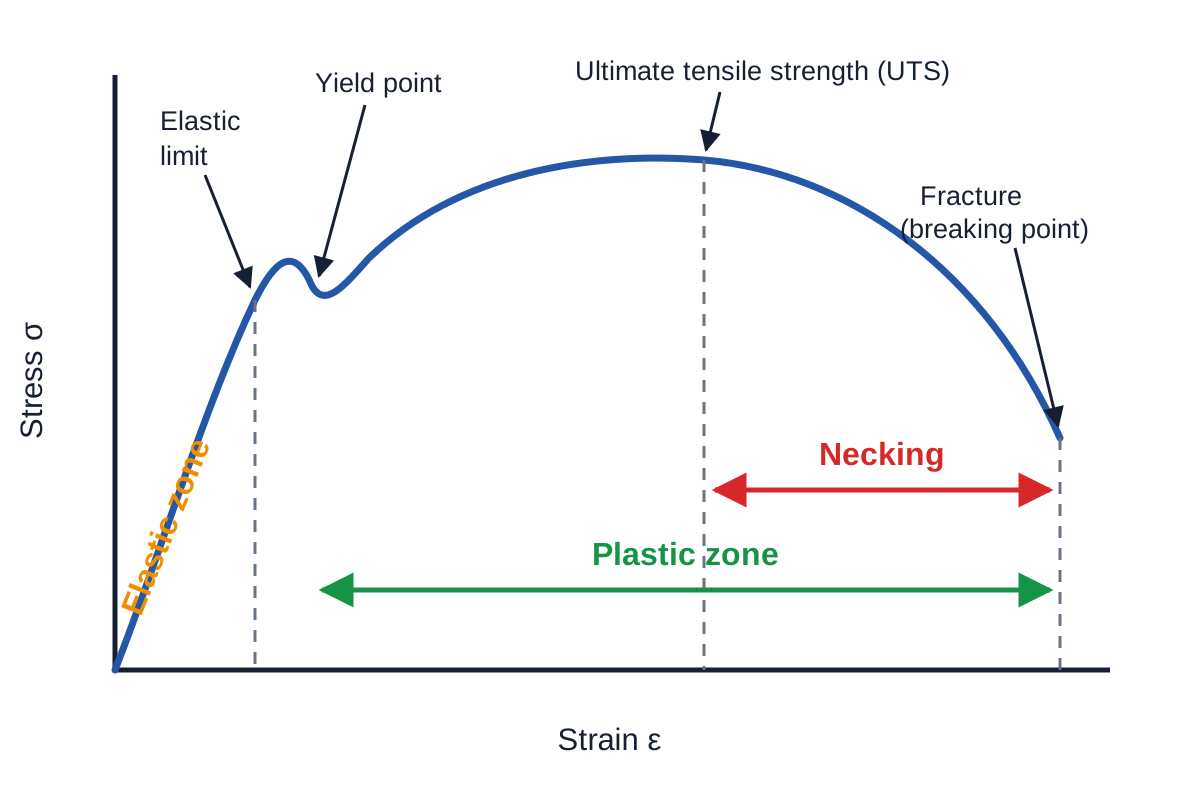
Understanding the axes
- Vertical axis — Stress (σ): Force per unit of original cross-sectional area, usually measured in MPa.
- Horizontal axis — Strain (ε): Change in length divided by original length; it has no units.
The typical curve described below is characteristic of some ductile metals, particularly certain low-carbon steels. Not all materials show a distinct yield point or a necking stage.
1. Elastic Region
In the elastic region, deformation is reversible: the specimen returns to its original length when the load is removed.
In the initial straight-line section, stress is proportional to strain. The slope gives Young's modulus (E), a measure of the material's elastic stiffness:
E=σεChair leg
When a person sits on a chair, its legs may shorten slightly under compression. If they return to their original length when the person stands up, the deformation was elastic.
2. Elastic Limit
The elastic limit is the greatest stress at which the material can recover its original dimensions completely after unloading. Beyond it, permanent deformation can occur.
Steel specimen
A 1,000 mm specimen stretches while loaded. If it measures 1,003 mm after the load is removed, it has retained 3 mm of permanent extension: its elastic limit was exceeded.
3. Yield Point
The yield point marks the onset of noticeable plastic deformation. Certain low-carbon steels exhibit a distinct yield phenomenon, sometimes with a small drop in engineering stress as deformation continues.
For materials without a clear yield point, engineers often use a conventional value such as 0.2% proof stress.
Design implication: Structural components should normally remain below their allowable stress in service, with an appropriate safety factor.
4. Plastic Region
In the plastic region, some deformation remains after the load is removed. The material may still carry load without breaking.
Permanent extension
A steel specimen starts at 1,000 mm, reaches 1,050 mm under load and measures 1,040 mm after unloading. It has a permanent extension of 40 mm.
Plastic deformation is useful in manufacturing processes such as bending, stamping and forming sheet metal.
5. Ultimate Tensile Strength (UTS)
UTS is the maximum engineering tensile stress recorded during the tensile test: the highest point of the engineering stress–strain curve.
UTS=FmaxA0Here, Fmax is the maximum tensile force and A0 is the original cross-sectional area.
UTS calculation
A specimen with an original cross-sectional area of 100 mm² reaches a maximum load of 40,000 N:
UTS=40000100=400N/mm2=400MPaUTS is not necessarily the fracture point. Ductile specimens can continue deforming after reaching it.
6. Necking
After UTS, a ductile specimen may develop necking: deformation becomes concentrated in a small region, and its cross-sectional area decreases rapidly.
The engineering stress curve drops because the force carried by the specimen decreases, while the calculation still uses the original area A0. The true stress in the narrowed region may continue to rise.
7. Fracture
Fracture is the final separation of the specimen into two pieces. In a typical ductile tensile test, it follows plastic deformation and necking.
Summary of the Graph
| Region or point | What happens? | Permanent deformation? |
|---|---|---|
| Elastic region | The specimen changes length but recovers when unloaded. | No |
| Elastic limit | Highest stress for fully reversible deformation. | Beyond this point |
| Yield point | Noticeable plastic deformation begins. | Yes |
| Plastic region | The specimen continues deforming permanently. | Yes |
| UTS | Maximum engineering tensile stress is reached. | Yes |
| Necking | A small region becomes progressively thinner. | Yes |
| Fracture | The specimen breaks. | Yes |
Important distinctions
- Elastic limit and yield point are related but not identical.
- Plastic deformation continues through necking until fracture.
- This graph represents a tensile test; components under compression may fail differently.
Why Is This Important in Design Technology?
Consider the legs of a chair. Designers need to determine:
- Will the legs deform permanently? Keep normal operating stresses within safe limits.
- How much will the legs deform? Use elastic behaviour and Young's modulus to estimate changes in length.
- What happens under excessive loading? Consider yielding and possible failure.
Chair legs mainly carry compressive loads, so designers must also assess buckling (loss of stability), which may occur before the material reaches its strength limit.
Key Takeaway
A stress–strain graph helps designers evaluate three important material properties:
- Stiffness: Resistance to elastic deformation.
- Strength: Ability to withstand stress before reaching a specified mechanical limit.
- Ductility: Ability to undergo plastic deformation before fracture.
Understanding these properties supports safe material selection and efficient product design.
3.2.6 Young's Modulus and Material Selection
Young's modulus E measures stiffness in the linear elastic region:
E=stressstrain=σε| High Young's modulus | Low Young's modulus |
|---|---|
| steep stress–strain slope | shallow stress–strain slope |
| small elastic deformation under load | larger elastic deformation under load |
| useful for frames, beams and precision machines | useful for seals, cushions and flexible components |
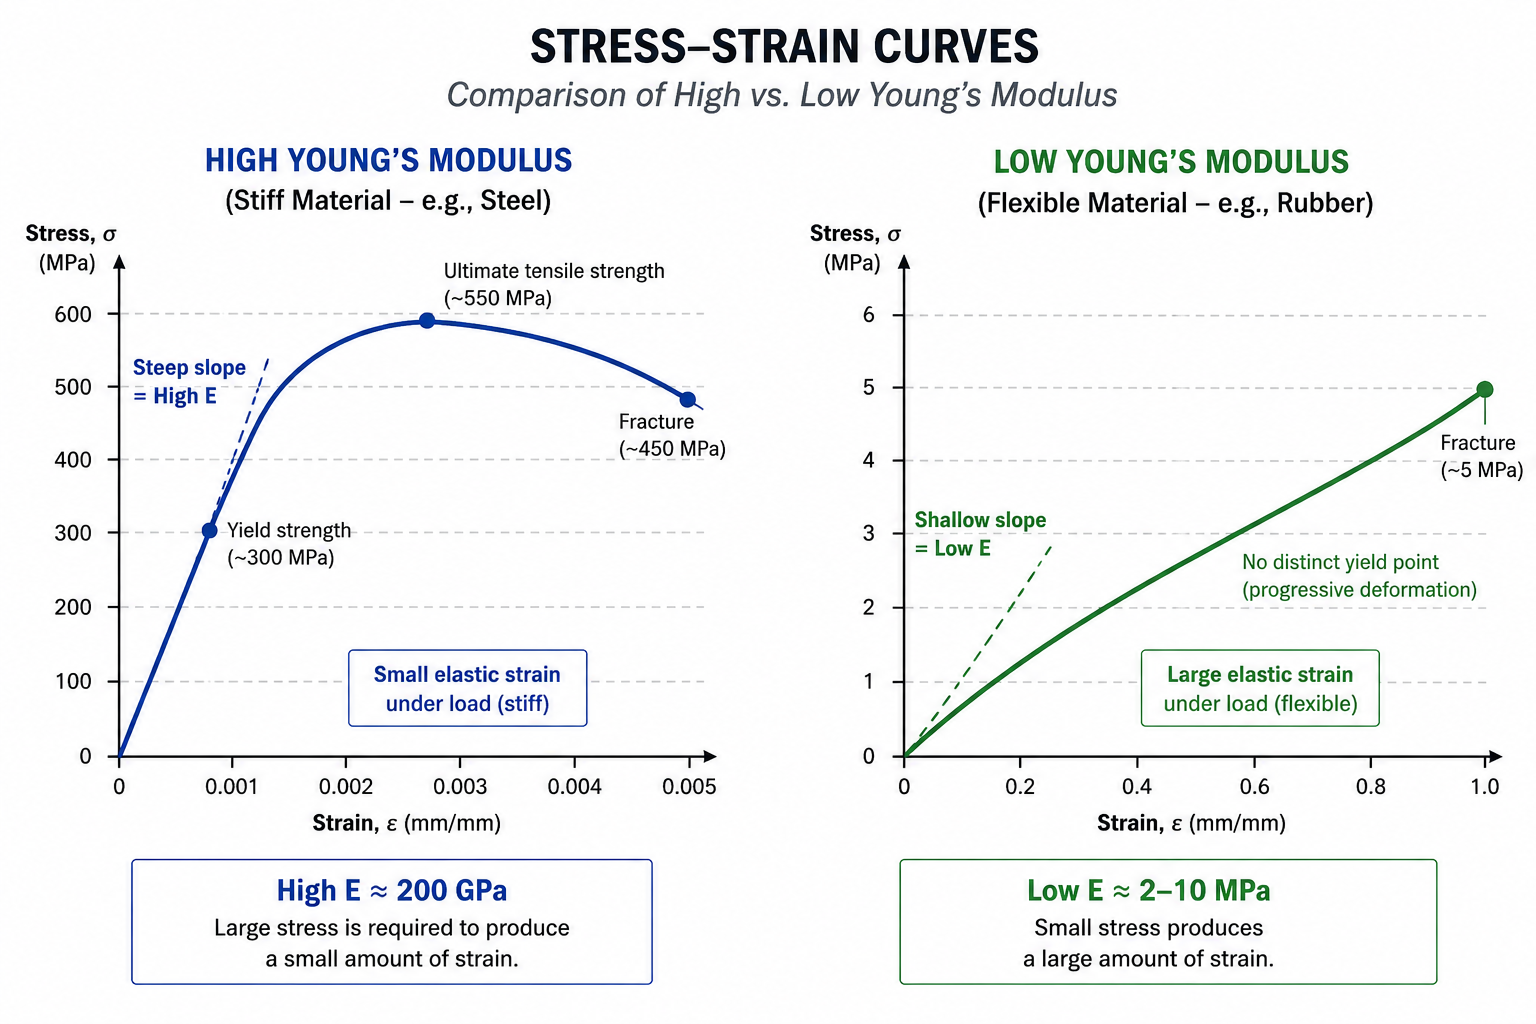
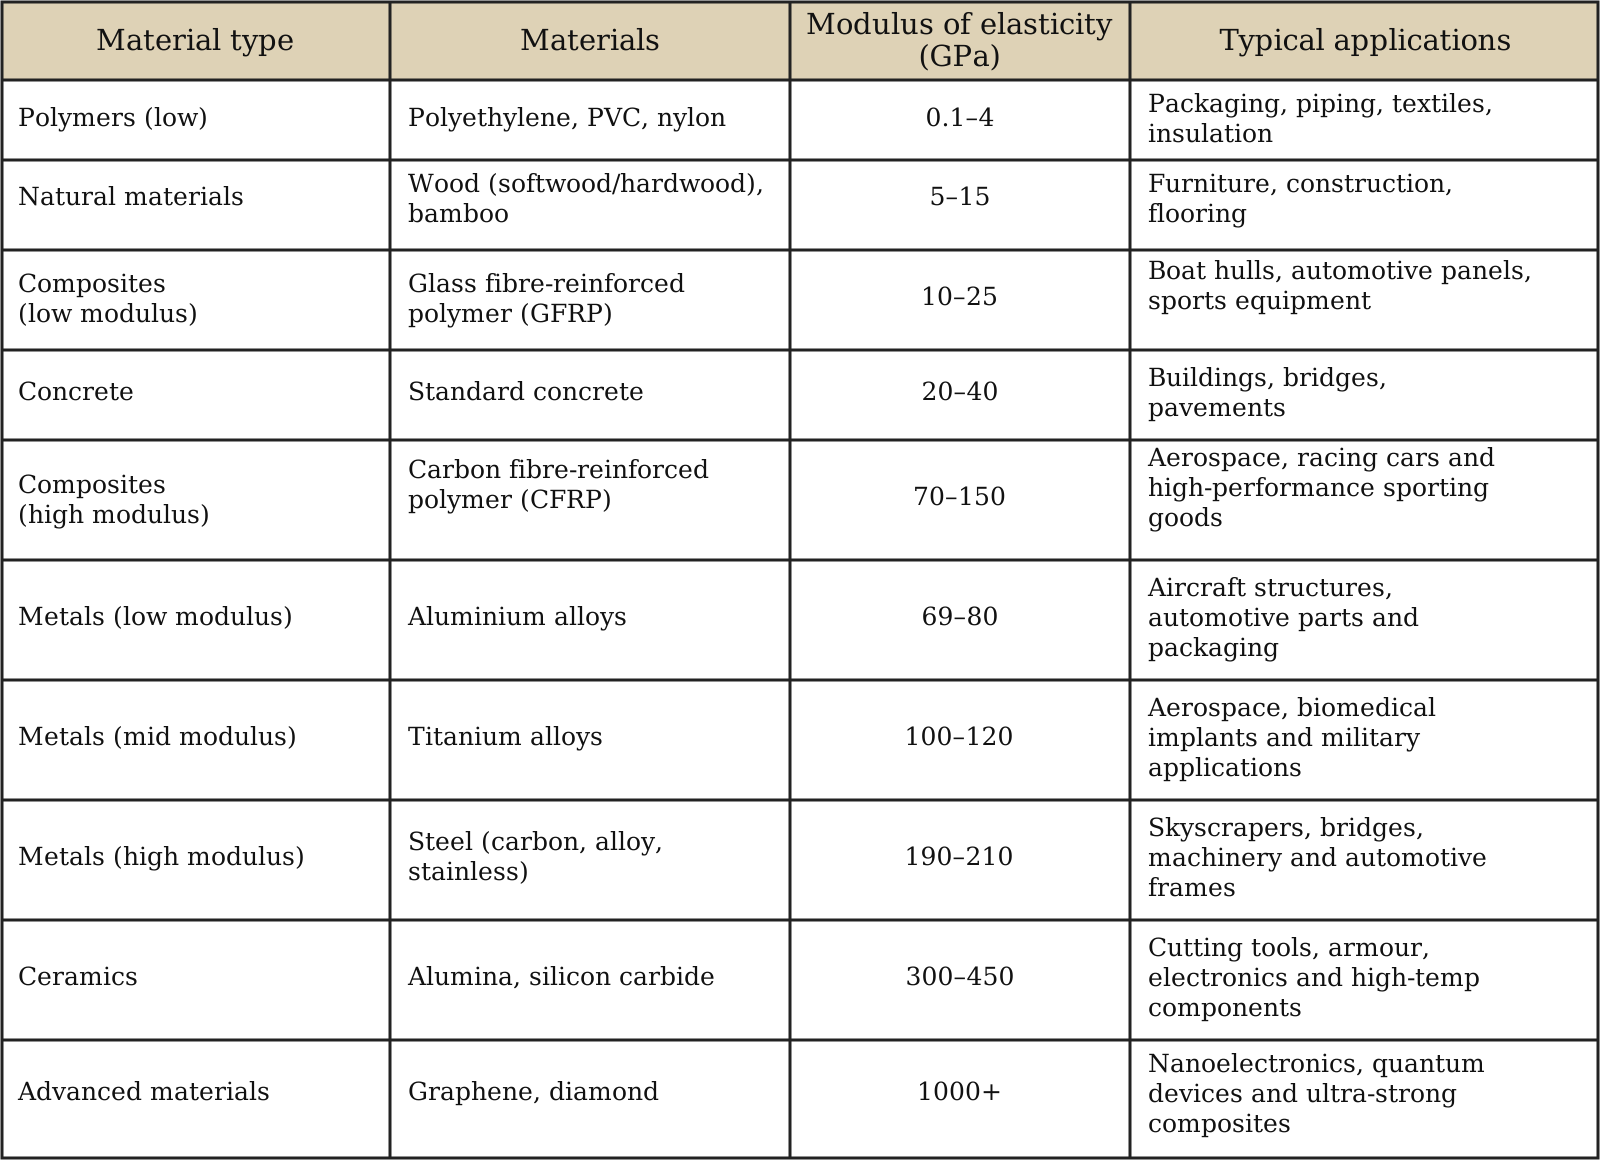
A high Young's modulus means stiff, not automatically strong.
Material-selection sentence frames
Complete both sentences before opening the model answers:
- High Young's modulus: “I would select ___ because its high Young's modulus means it will ___ under the expected load, which is important because ___.”
- Low Young's modulus: “I would select ___ because its low Young's modulus means it will ___ under the expected load, which is important because ___.”
Show model answers
-
High Young's modulus — machine frame: “I would select steel because its high Young's modulus means it will deform very little under the expected load, which is important because the machine must remain rigid and accurate.”
-
Low Young's modulus — sealing strip: “I would select rubber because its low Young's modulus means it will deform easily and conform to the surfaces under the expected load, which is important because it must create an effective air- and watertight seal.”
Design context matters
An earthquake-resistant building needs strength but may also need controlled flexibility and energy dissipation. The “best” material is therefore not always the stiffest one: designers balance stiffness, strength, toughness, mass, cost and manufacturing.
A 3.2.7 – Equilibrium of Forces
A structure is in equilibrium when all the forces and moments (torques) acting on it are balanced.
This means that the structure does not accelerate or start rotating unexpectedly. Two conditions must be satisfied.
1. Translational Equilibrium
Translational equilibrium occurs when the sum of all forces acting on a structure is zero.
Forces must be balanced in both the horizontal and vertical directions:
∑Fx=0∑Fy=0Chair example
When a person sits on a chair, their weight acts downwards. The floor exerts an upward reaction force through the chair legs. If these forces balance, the chair does not accelerate vertically.
2. Rotational Equilibrium
Rotational equilibrium occurs when the sum of all moments (torques) acting on a structure is zero.
A moment is the turning effect of a force about a point or axis.
∑M=0Chair example
When a person sits normally, the forces and moments can remain balanced, keeping the chair at rest. However, leaning too far backwards may create an unbalanced moment and cause the chair to tip over.
A structure can have balanced forces and still rotate if its moments are not balanced.
3. Why Can a Structure Fail?
Four common causes are:
| Cause | Explanation |
|---|---|
| Overloading | Applied forces exceed the structure's strength, causing deformation or failure. |
| Uneven force distribution | Loads are not distributed evenly, so some components experience excessive forces or stresses. |
| Foundation instability | The base or supports shift, sink, or fail to provide adequate support. |
| Dynamic impacts | Sudden forces, such as impacts or vibrations, can disturb the structure's equilibrium. |
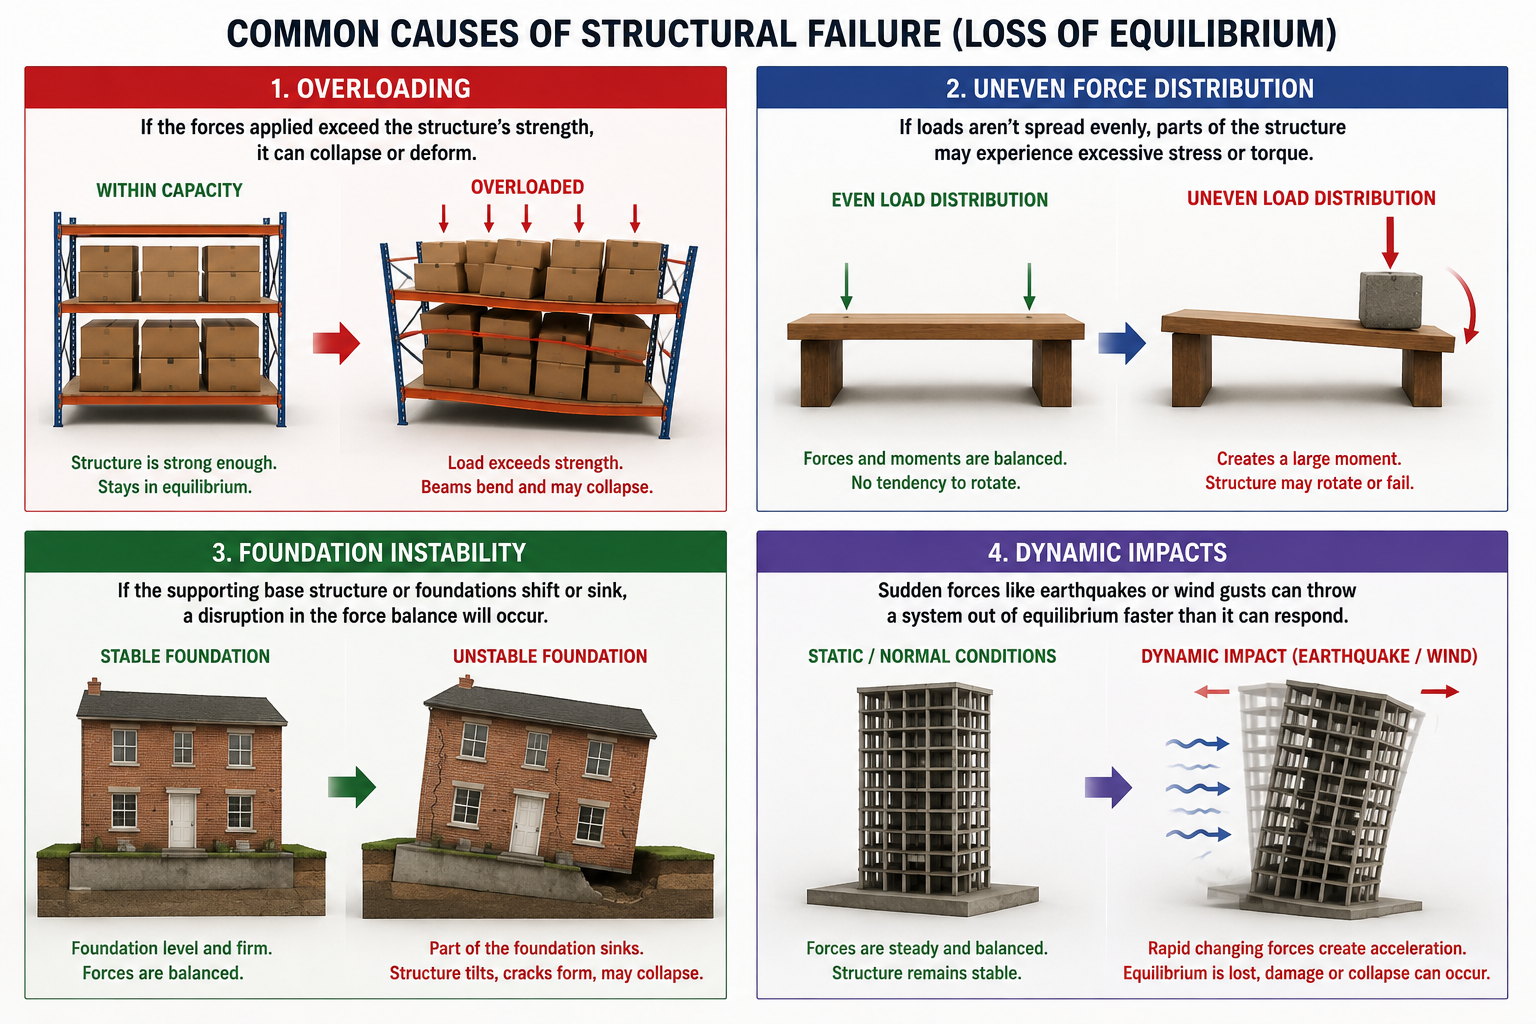
Important distinction
A structure can be in external equilibrium and still fail if its members are not strong or stiff enough. Equilibrium describes balance; strength describes whether the structure can resist the resulting internal stresses.
Failure risk increases when: loads are too large · loads are badly distributed · supports move · forces change suddenly
A 3.2.8 – Strengthening Structures
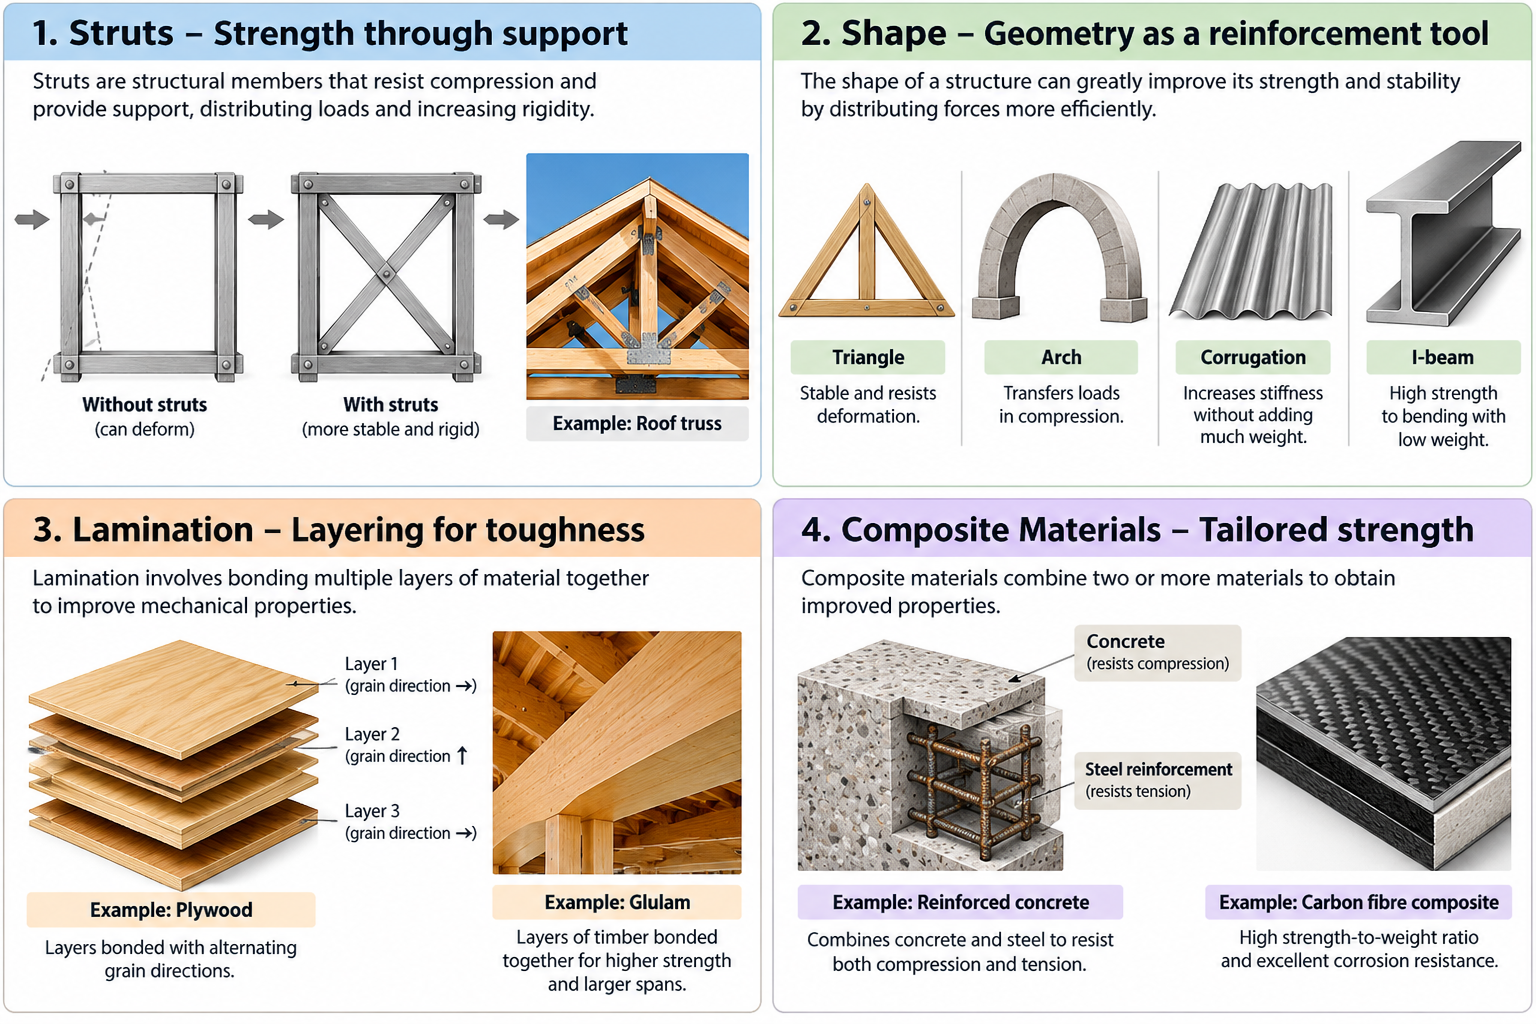
The strength and stability of a structure can be improved using four main techniques, without necessarily increasing the amount of material significantly.
1. Struts – Strength Through Support
Struts are structural members designed primarily to resist compression and provide support.
They help to:
- Distribute loads between different parts of a structure.
- Prevent buckling by supporting long, slender members.
- Increase rigidity, reducing unwanted deformation.
Example: Roof trusses
Compression members in triangular roof trusses help support the roof and transfer loads to the supporting structure. Depending on the loading, other members may be in tension.
2. Shape – Geometry as a Reinforcement Tool
The shape of a structure affects its strength and stability. Good geometry allows forces to be carried more efficiently, often with less material.
- Triangles: Provide geometric stability and resist changes in shape.
- Arches and domes: Transfer loads mainly through compression.
- Corrugation: Ridges or waves increase the bending stiffness of thin sheets in certain directions.
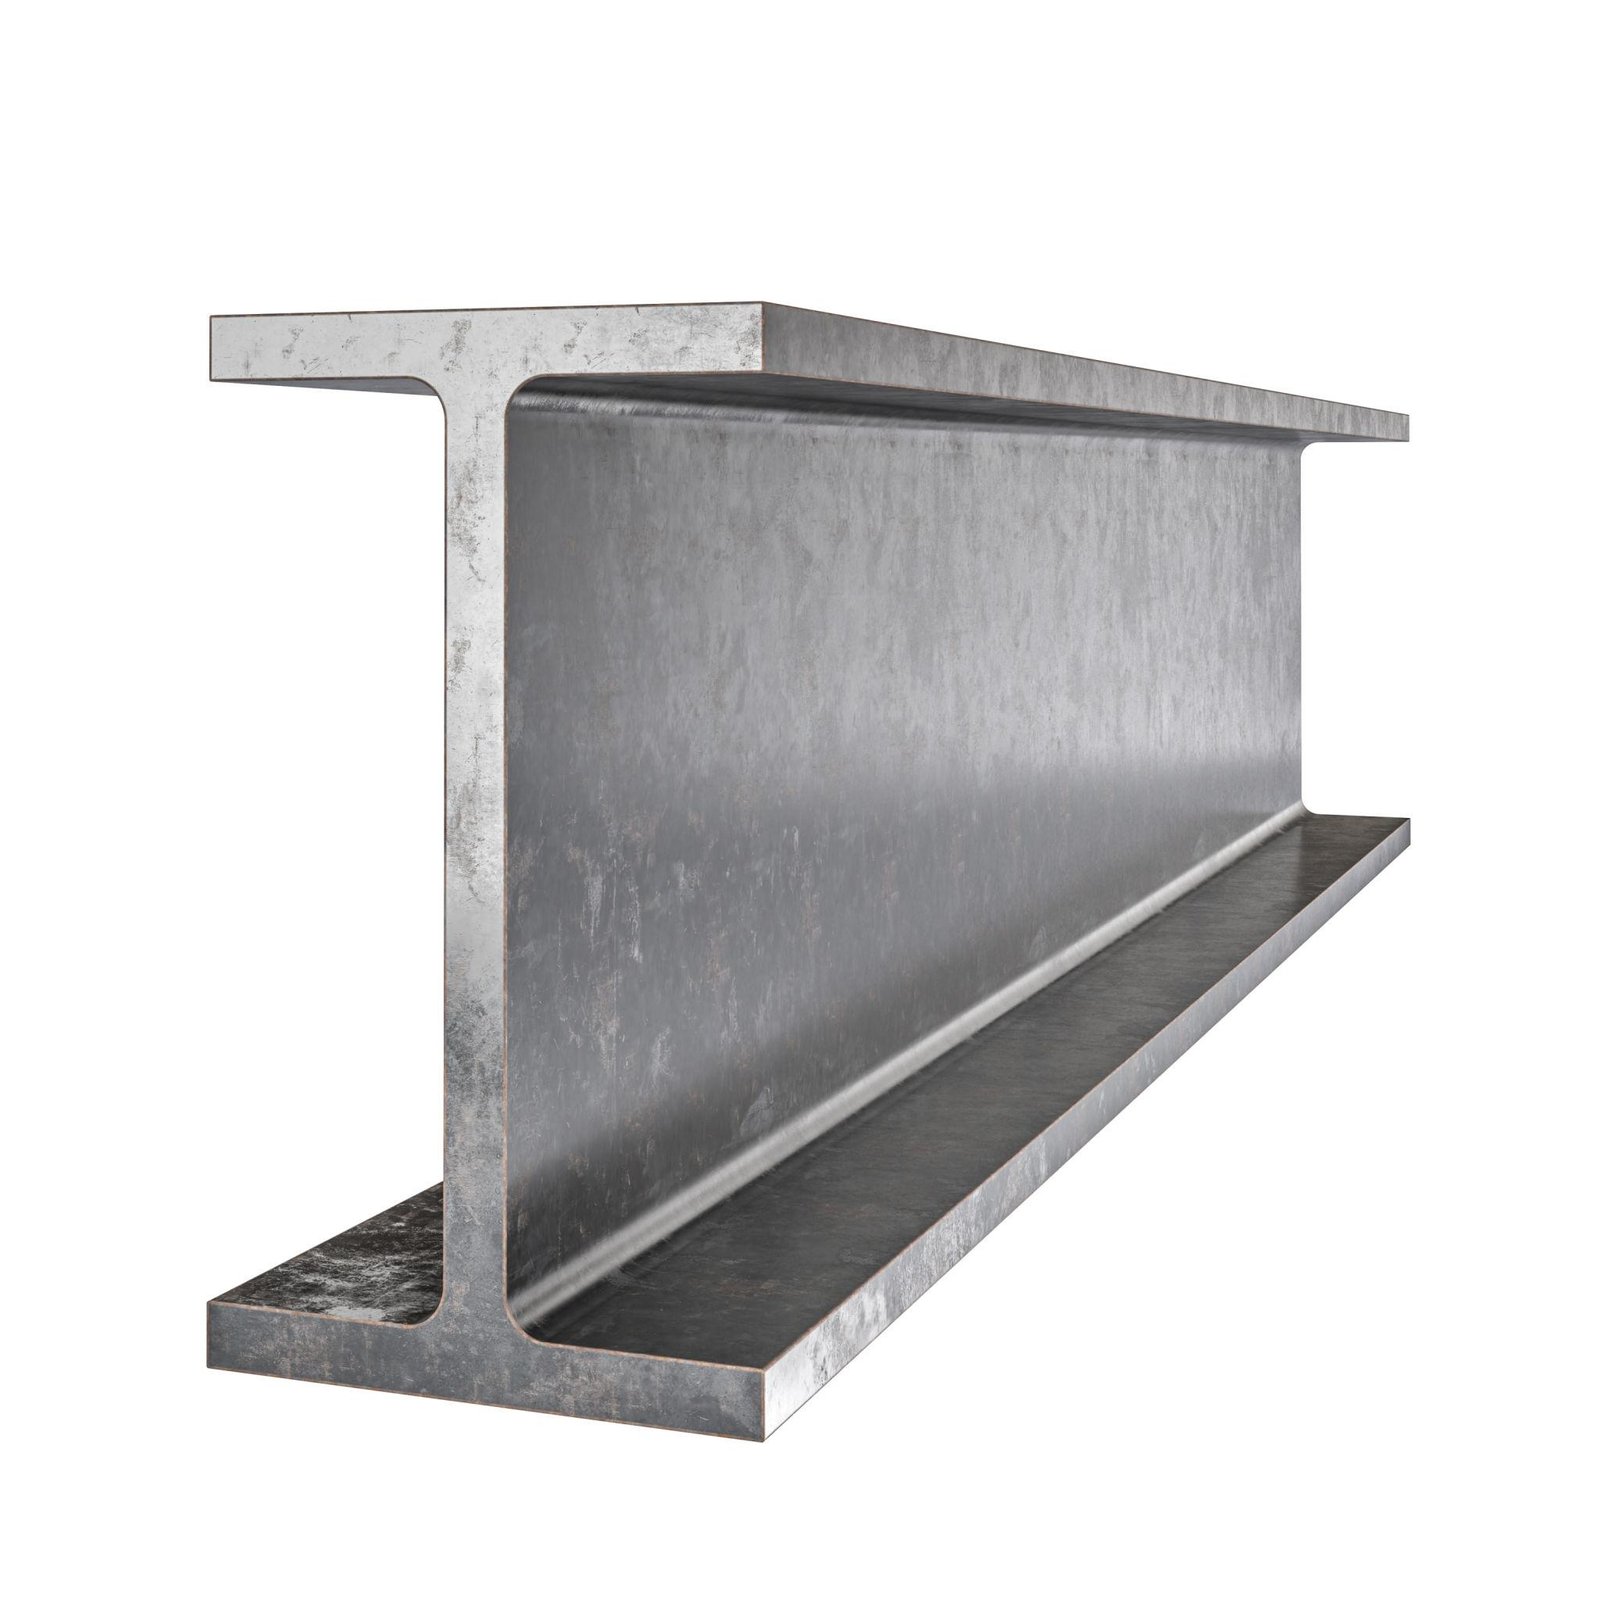
- I-beams: Their I-shaped cross-section provides high bending stiffness and strength with relatively low weight.
Example: I-beams
I-beams are widely used in buildings and bridges because their shape efficiently resists bending.
3. Lamination – Layering for Toughness
Lamination involves bonding several layers of material together to improve the properties of a component.
It can:
- Improve toughness: Help absorb energy and limit crack propagation.
- Control flexibility: Adjust how a component bends through the choice and orientation of layers.
- Combine properties: Use different layers to provide complementary functions.
Example: Plywood
Plywood is made from thin wood veneers bonded together, usually with the grain direction alternating between adjacent layers. This improves dimensional stability and performance in different directions.
4. Composite Materials – Tailored Strength
Composite materials combine two or more distinct materials to achieve useful properties that the individual materials do not provide in the same way.
Main advantages include:
- High strength-to-weight ratio: Strong components with relatively low weight.
- Directional strength: Reinforcement can be oriented to resist forces in specific directions.
- Corrosion resistance: Many composites perform well in corrosive environments.
Example: Reinforced concrete
Reinforced concrete combines concrete, which is strong in compression, with steel reinforcement, which helps resist tensile forces.
5. Summary – Strengthening Techniques
| Technique | How does it work? | Main benefits | Examples |
|---|---|---|---|
| Struts | Add members that resist compression and transfer loads. | Stability, load distribution and rigidity. | Roof trusses, scaffolding. |
| Shape | Use geometry to manage forces efficiently. | Structural efficiency, strength and rigidity. | Triangles, arches, I-beams. |
| Lamination | Bond multiple layers of material together. | Toughness, controlled flexibility and improved mechanical properties. | Plywood, laminated glass, CLT. |
| Composite Materials | Combine different materials to achieve complementary properties. | High strength-to-weight ratio, directional strength and durability. | Carbon-fibre composites, reinforced concrete. |
Key takeaway
Structural strength and stability can be improved through reinforcement, geometry, layering and material combinations. The designer's goal is to create a strong, stable and efficient structure using an appropriate amount of material.
A 4.3.9 – Factor of Safety
1. What is the Factor of Safety?
The Factor of Safety (SF or FOS) is a safety margin incorporated into a structure's design to reduce the risk of failure when loads exceed those expected during normal use.
Example: A chair
Imagine a chair designed for an expected load equivalent to 100 kg, while its components can withstand a load equivalent to 300 kg under the same conditions.
SF=300100=3The chair has a factor of safety of 3: its load capacity is three times the expected load. This simplified example compares equivalent loads under the same conditions.
2. How is it calculated?
The textbook uses the following formula:
FOS=UTSσWhere:
- FOS: Factor of Safety.
- UTS: Ultimate Tensile Strength — the maximum engineering tensile stress reached by the material.
- σ: Working Stress — the stress experienced during use.
Worked example
A metal rod has a UTS of 300 MPa and experiences a working stress of 100 MPa.
FOS=300100=3The material's ultimate tensile strength is three times its working stress.
Important distinction
For ductile materials, designers commonly use yield strength rather than UTS when the aim is to prevent permanent deformation. The appropriate safety factor also depends on the failure mode and applicable standards.
3. What determines the Factor of Safety?
Different products require different safety margins.
| Factor | Influence on the Factor of Safety |
|---|---|
| Risk of failure | More serious consequences of failure generally require greater safety margins. |
| Predictability of loads | Uncertain loads may require a higher SF. |
| Material reliability | Well-characterised materials reduce uncertainty. |
| Manufacturing quality | Less consistent manufacturing may require greater margins. |
| Environmental conditions | Corrosion, temperature changes and wear may require a higher SF. |
| Cost and weight | A higher SF can increase material use, weight and cost. |
4. Examples of Factors of Safety
The following are illustrative values from the textbook, not universal design requirements.
| Application | Approximate Factor of Safety (SF) |
|---|---|
| Aircraft wings | 1.5 |
| Furniture | 1.5 |
| Ladders | 2 |
| Bridges | 2–2.5 |
| Industrial boilers | 4 |
| Cranes | 5 |
Safety factors vary because products experience different loads, use different materials, operate in different environments and have different consequences if they fail.
5. Key Takeaway for Design Technology
The Factor of Safety provides a margin between the expected working stress and the strength limit used in the design.
- SF < 1: The chosen strength limit is exceeded.
- SF = 1: There is no margin relative to that limit.
- SF > 1: A margin exists relative to that limit.
A higher SF provides a larger margin relative to the chosen limit, but may increase weight, material use and cost.
Design objective
Choose an appropriate factor of safety to make the product safe without unnecessarily increasing its size, weight or cost. A factor of safety alone does not guarantee safety: designers must also check relevant failure modes and standards.
Why include a margin?
Real conditions contain uncertainty:
- variation in material properties and dimensions;
- manufacturing defects;
- unexpected or uneven loads;
- impact, vibration and fatigue;
- corrosion, wear and ageing;
- errors in use, inspection or maintenance.
Important
A higher safety factor is not free: it can increase mass, cost and environmental impact. The required value depends on consequences of failure, uncertainty, standards and the design method used.
A 3.2.10 – Designing Structures to Withstand Higher Loads
Structures are designed to withstand higher loads than those expected during normal use, providing an additional margin of safety.
A Factor of Safety (SF) of 1 means that a structure can withstand only the maximum expected load, with no additional safety margin.
Why is an SF of 1 risky?
Because it assumes that real-world conditions will always be exactly as expected, which is rarely realistic.
There are four main reasons for incorporating additional strength:
-
Material Variability: Materials may contain defects or variations in strength that reduce their ability to withstand loads.
-
Load Unpredictability: Actual forces may exceed expected loads due to impacts, overloading or unexpected use.
-
Wear and Ageing: Materials may lose strength over time due to corrosion, fatigue or wear.
-
Human Safety: Structural failure can cause injuries, making appropriate safety margins essential.
Practical Example: A Chair
A chair designed to support exactly 100 kg, with no additional safety margin, could fail if someone sits down suddenly or if its materials lose strength over time.
Key Takeaway
Structures must have additional strength to account for uncertainties in manufacturing, use and ageing, reducing the risk of structural failure.